
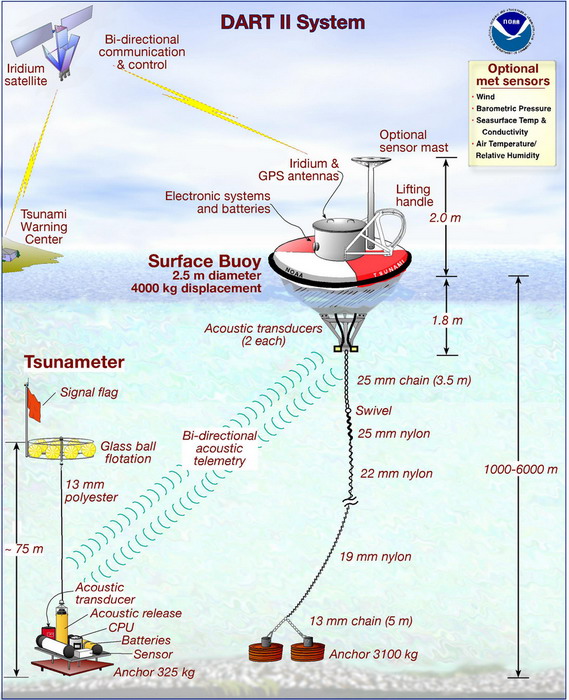
The DART II Tsunami System.[i] (Diagram courtesy of NOAA)
On 11 April 2012 at 2:38:37 p.m. local time (08:38:37 UTC), approximately 269 miles off the west coast of northern Sumatra, Indonesia[ii] there was a magnitude 8.6 Richter Scale earthquake.[iii] Within minutes, buoys from the Deep-ocean Assessment and Reporting of Tsunamis (DART®) system detected and reported ocean level changes resulting from the earthquake, enabling the DART system to accurately predict that the resultant “tsunami would not be big.” [iii] Given this region’s experience with tsunamis, this was vital information that made a difference for thousands of people!
DART buoys are positioned at 54 locations around the world and are operated by the U.S. National Oceanic and Atmospheric Administration (NOAA) and six other countries.[iv] “Originally developed by NOAA, as part of the U.S. National Tsunami Hazard Mitigation Program … the DART® Project was an effort to maintain and improve the capability for the early detection and real-time reporting of tsunamis in the open ocean.”[v] Since 2008, the National Data Buoy Center (NDBC) has operated 40 DART II buoys, primarily around the Pacific Rim and along the U.S. eastern seaboard.
As the diagram above shows, each DART II buoy location “consists of two physical components: a tsunameter on the ocean floor [the bottom pressure reader (BPR)] and a surface buoy with satellite telecommunications capability. The DART II systems have bi-directional communication links and are thus able to send and receive data from the Tsunami Warning Center and others via the Internet.”[vi]
The BPR collects temperature and pressure data which are converted to an estimated sea-surface height every 15 minutes while the system is operating in standard mode reporting.[v] With this data, the “Tsunami Detection Algorithm works by first estimating the amplitudes of the pressure fluctuations within the tsunami frequency band, and then testing these amplitudes against a threshold value…. If the amplitudes exceed the threshold, the tsunameter goes into Event Mode to provide detailed information about the tsunami.”[vii] Once the BPR enters into the event mode “15-second values are transmitted during the initial few minutes, followed by 1-minute averages. Event mode messages also contain the time of the initial occurrence of the event.” [v]
For the 11 April 2012 earthquake, a DART II station in the Bay of Bengal reported the event 2:23 minutes after the earthquake. The next closest DART II station (600 nautical miles West-Northwest of Phuket, Thailand) reported an event after an additional 1:15 minutes. A third DART II station reported an event after another 2:15 minutes. Thus, in less than 6 minutes, three DART II stations had recorded this earthquake and transmitted wave height information to the Tsunami Warning Center enabling the Center to determine that the resultant wave would have limited destructive potential.
Relating “readiness” and “availability”
Although the 11 April 2012 tsunami determination was timely and effective, when the earthquake occurred, only 38 of the 54 DART II buoy locations worldwide were on-line and reporting wave height data — a systemwide point availability of 70 percent. This compares to an 80 percent reliability and data return (i.e., availability) goal for the DART II system.[viii]
The relationship between readiness and availability was examined in an earlier posting on this blog. Readiness was defined as the “ability to provide capabilities required by the combatant commanders to execute their assigned missions. This is derived from the ability of each unit to deliver the outputs for which it was designed.”[ix] From there, the assessment methods that were described expressed system readiness as a function of personnel, materiel, equipment, and training.
Of course, for readiness-based sparing, the most relevant component of these readiness assessment systems is materiel supportability which directly contributes to equipment availability. According to Blanchard, availability is “the measure of the degree a system is in the operable and committable state … when the mission is called for at an unknown random point in time.”[x]
System availability
The availability of a fielded system in normal operations is dependent upon its supporting maintenance infrastructure. As defined in the U.S. Department of Defense (DoD) reliability, availability and maintainability (RAM) guide “Availability as measured by the user is a function of how often failures occur and corrective maintenance is required, how often preventative maintenance is performed, how quickly indicated failures can be isolated and repaired, how quickly preventive maintenance tasks can be performed, and how long logistics support delays contribute to down time.”[xi]
Maintenance categories
There are two basic categories of maintenance. The first category, corrective maintenance, is “the unscheduled actions accomplished, as a result of failure, to restore a system to a specified level of performance.”[xii] Part demands arising from corrective maintenance are referred to as independent demands which must be forecasted. The following figure illustrates the main components of the corrective maintenance cycle at an operational location for a first level indenture line replaceable unit (LRU).[xiii]

The Corrective Maintenance Cycle.
The second maintenance category, preventive maintenance, is “the scheduled actions accomplished to retain a system at a specified level of performance by providing systematic inspection, detection, servicing, condition monitoring, and/or replacement to prevent impending failures.”[xiv] Parts demands arising from preventive maintenance are commonly referred to as dependent demands (since they are determined by the scheduled maintenance activities) and their quantities may be derived from the maintenance schedule.
Availability measures
The support environment predictability that the two categories of maintenance are performed in is the fundamental difference between inherent and operational availability – two of the most common measures of system availability.
When it is important to examine the reliability-maintainability trade-offs for a system’s design, then inherent availability is an appropriate system performance measure.[xv] As defined by Blanchard, inherent availability “is the probability that a system or equipment, when used under stated conditions in an ideal support environment (i.e., readily available tools, spares, maintenance personnel, etc.), will operate satisfactorily at any point in time as required. It excludes preventive or schedule maintenance actions, logistics delay time, and administrative delay time….”[xvi]
Unfortunately for operators and logisticians, the systems they support don’t operate in such an ideal environment. As the DoD RAM Guide notes, operational availability becomes the more appropriate measure when “the effects of design and the support system on availability are being considered….”[xvii]
Blanchard defines operational availability as the “probability that a system or equipment when used under stated conditions in an actual operational environment, will operate satisfactorily when called upon.”[xviii] The availability definition has now expanded to include the impacts of both maintenance categories – corrective and preventive, and the “actual” operating environment is affected by all of today’s logistical realities “the availability of spare and repair parts, tools, support equipment, and maintenance personnel….”[xix] This is the environment where the effectiveness and efficiency of readiness-based sparing comes into play.
Summary
Clearly, for a complex system (such as the DART® system) to make a difference, it must be properly designed, maintained and supported to be available when needed. Furthermore, it’s important to use an appropriate availability measure when designing, building and evaluating this support environment. In the next posting, we’ll take a closer look at how these alternative availability measures are calculated and how they’re routinely employed by today’s logistics practitioners.
[i] NOAA Center for Tsunami Research, DART II System. Downloaded from http://nctr.pmel.noaa.gov/Dart/Jpg/DART_II_metric-page.jpg on 18 Feb 2011.
[ii] U.S. Geological Survey. Magnitude 8.6 - Off the West Coast of Northern Sumatra, Downloaded from http://earthquake.usgs.gov/earthquakes/eqinthenews/2012/usc000905e/#details on 18 April 2012.
[iii] “Surveying minimal damage from twin quakes, Indonesians can’t believe their luck,” The Washington Post, 12 April 2012, downloaded from http://www.washingtonpost.com/world/asia_pacific/surverying-minimal-damage-from-twin-quakes-indonesians-cant-believe-their-luck/2012/04/12/gIQAT26UCT_story.html\ on 12 April 2012.
[iv] National Data Buoy Center. Deep-ocean Assessment and Reporting of Tsunami system location map at http://www.ndbc.noaa.gov/dart.shtml accessed on 18 April 2012.
[v] National Data Buoy Center. “Deep-ocean Assessment and Reporting of Tsunamis (DART®) Description.” Downloaded from http://www.ndbc.noaa.gov/dart/dart.shtml on 29 Mar 2011.
[vi] Meinig, Christian., et al. “Real-Time Deep-Ocean Tsunami Measuring, Monitoring, and Reporting System: The NOAA DART II Description and Disclosure.” 2005. Downloaded from http://www.ndbc.noaa.gov/dart/dart_ii_description_6_4_05.pdf on 28 Feb 2011. (p. 5)
[vii] Meinig (p. 8)
[viii] Meinig (p. 6)
[ix] U.S. Department of Defense. Department of Defense Dictionary of Military and Associated Terms. Joint Publication 1-02. Washington: 8 November 2010 (as amended through 15 January 2012). (Page 277) Downloaded from http://www.dtic.mil/doctrine/new_pubs/jp1_02.pdf on 18 March 2012.
[x] Blanchard, Benjamin S. Logistics Engineering and Management (Second Edition). Englewood Cliffs, NJ: Prentice-Hall, Inc., 1981. (p. 20)
[xi] U.S. Department of Defense. DOD Guide for Achieving Reliability, Availability, and Maintainability. Office of the Under Secretary of Defense (Acquisition, Technology and Logistics). Washington: 3 August 2005. (p. 1-1)
[xii] Blanchard (p. 35)
[xiii] Phillips, Shawn M. Improving Marine Corps Total Life Cycle Management by Connecting Collected Data and Simulation. MS Thesis. Naval Postgraduate School, Monterey, CA, June 2009. (p. 28)
[xiv] Blanchard (p. 35)
[xv] Ebeling, Charles E. An Introduction to Reliability and Maintainability Engineering. Long Grove, IL: Waveland Press, Inc., 1997. (p. 255)
[xvi] Blanchard (p. 66)
[xvii] DoD RAM Guide (p. 3-10)
[xviii] Blanchard (p. 67)
[xix] DoD RAM Guide (p. 3-9)
No comments:
Post a Comment